Graph of Inverse Cosine Function
The graph of the inverse cosine function is a lot like the graph of the inverse sine function. They're tight like that. It needs to be chopped into pieces, too, in order to pass the vertical line test. Poor inverse trig functions. They never get to be themselves.
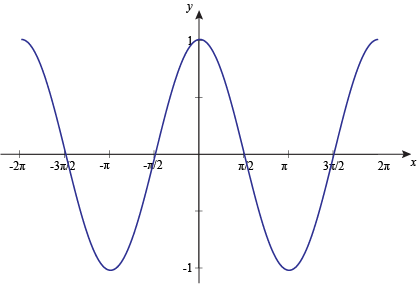
To graph the inverse cosine function, we limit or choose a section of our regular cosine graph to work with. Here's y = cos x.
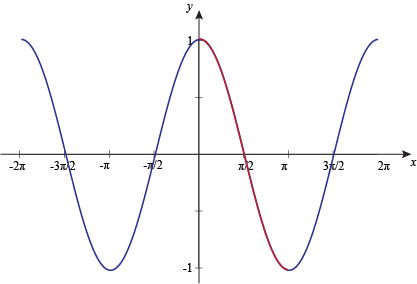
Next, we limit the domain to [0°, 180°], or [0, π] if you're feeling radian-y.
To find the inverse cosine graph, we have to swap the variables, which gives us:
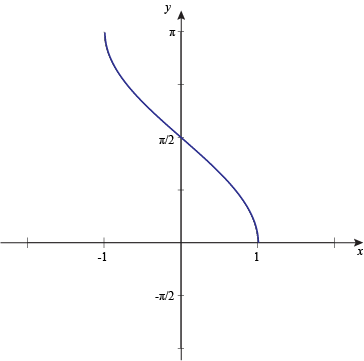
Inverse cos has a domain of [-1, 1] and a range of [0°, 180°], or [0, π].
That limits us to Quadrant I and Quadrant II when we're solving problems with the inverse cosine function.