The cosine function looks and acts a lot like its buddy, the sine function.
For the cosine function y = a cos(bx), the period (time it takes for one full cycle) is  Same as the sine.
The midline of y = a cos(bx) is always y = 0, just like the sine. It can shift up or down when we add a constant, but we'll save that for later on this page.
The amplitude (vertical distance between the midline and the "peaks") of y = a cos(bx) is |a|. If a < 0, the graph is flipped (inverted). Again, same deal as the sine.
Sheesh, what a copycat.
Sample Problem
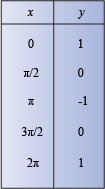
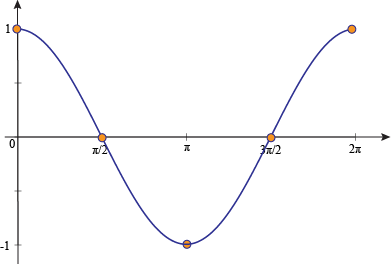
Graph y = cos x.
The amplitude of y = cos x is 1, the period is 2π, and the midline is just the x-axis.
Let's make our chart for y = cos x.
Plotting x versus y gives us this beauty:
Sample Problem
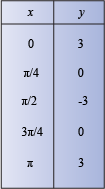
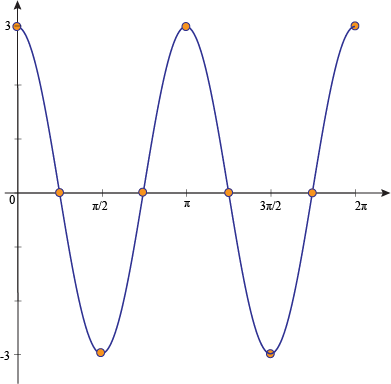
State the amplitude and period of y = 3cos(2x). Then graph the function.
Just compare it to y = a cos(bx) and start pluggin' stuff in.
amplitude = |a| = 3

This time, our graph is gonna complete one full cycle in π units instead of 2π units. In other words, it'll be more smooshed together.
Now graph it. Start with the table.
This time, we'll find our five key angles using the period π and our five key points using the amplitude 3.
When we graph this, we'll just follow the same pattern to extend the graph to 2π.
So far, all the cosine graphs we've looked at had the x-axis as their midline. (This gives us another axis to grind.)
Like sine graphs, cosine graphs can be shifted up or down from the x-axis.
In general, for y = k + cos x, the graph shifts up by k units when k > 0 and shifts down by k units when k < 0.
Sample Problem
Graph y = 3 + cos x.
The period is 2π and the amplitude is 1.
We apply the shift (vertical translation) of 3 to our key points.
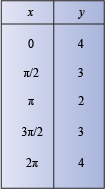
Now, graph the function from 0 to 2π.
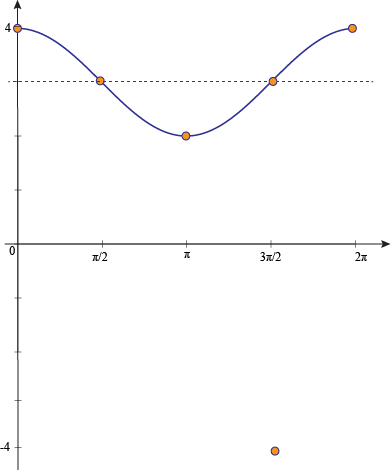
The midline for this guy is at y = 3.