First off, we're gonna throw some new terms at you. Hope you brought your catcher's mitt.
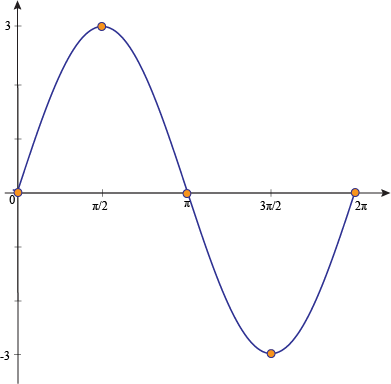
Your basic sine function has a shape like this:
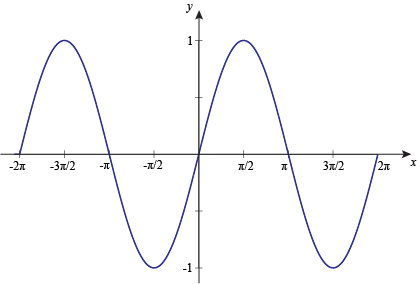
The period of a trig function is the horizontal length of one complete cycle. For example, the graph above starts repeating its shape after 2π units on the x-axis, so it's got a period of 2π.
In general, for y = a sin(bx), the period is 
A function's midline is pretty much exactly what it sounds like: a horizontal line running through the "middle" of our trig function. It'll be smack in-between the graph's maximum and minimum values. Since it's a horizontal line, it'll always look like y = (something).
For functions of the form y = a sin(bx) like the graph above, the midline is always just the x-axis, a.k.a. the line y = 0. We'll see what happens when that line slides around a bit later on.
The amplitude of a trig function is its "height," or the vertical distance between the midline and the maximum or minimum value. It's basically how tall the "waves" of the function get. The graph above has its peaks at y = 1 and y = -1, so its amplitude is just 1.
In general, for y = a sin(bx), the amplitude is |a|. It's also important to note that if a < 0, the graph is flipped (inverted).
Talk is cheap, so now let's see these in action.
Sample Problem
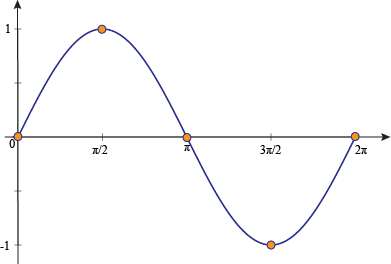
What does the graph of y = sin x look like?
The amplitude (maximum value) of y = sin x is |1| = 1. The period (the time it takes for one full cycle) of y = sin x is 2π⁄1 = 2π. The midline of y = sin x is the x-axis. Let's graph y = sin x.
Just like with any graph, it helps to make a chart of x- and y-values. Include five key angles using the period 2π, and five key points obtained from those angles.
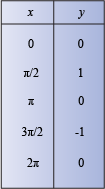
Plotting x versus y gives us:
Sample Problem
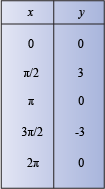
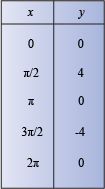
Graph y = 3 sin x.
This time, our amplitude is |3| = 3. Our period is still 2π⁄1 = 2π, and our midline is still y = 0.
Let's make our table.
We apply the period 2π to the five key angles, and the amplitude 3 to the five key points.
Plot your points.
Sample Problem
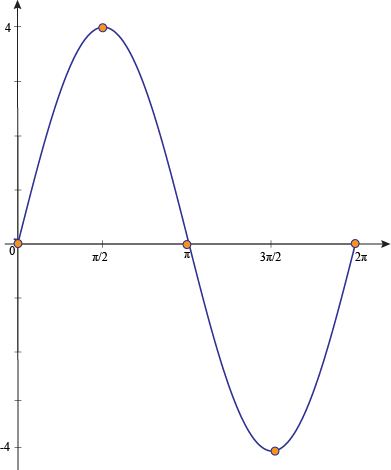
State the amplitude and period of y = 4 sin x. Then graph the function.
From y = a sin(bx), we get an amplitude of |4| = 4, and a period of 2π⁄1 = 2π.
Now graph it.
Start with the table.
When we graph this, we'll just follow the same pattern to extend the graph to 2π.
So far, all the graphs we've looked at have had the x-axis as their midline. We've been tossing softballs at ya. Sometimes, in the big leagues, graphs are translated, or moved up or down from the x-axis.
In general, for y = k + sin x, the graph shifts up by k units when k > 0 and shifts down by k units when k < 0.
Sample Problem
Graph y = 3 + sin x.
The period is 2π, and the amplitude is 1.
We apply the shift (vertical translation) of 3 to our key points.
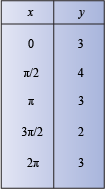
Now, graph the function from 0 to 2π.
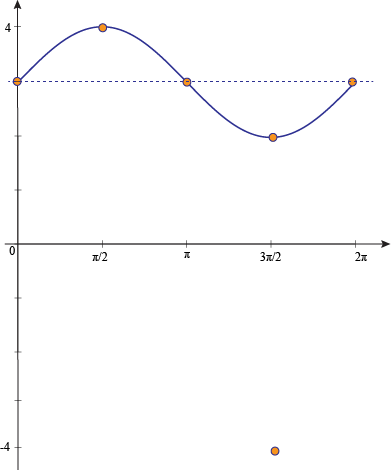
This time, our midline is at y = 3. It shifted upward 3 units because we added k = 3 to the regular old sine function.