To find the value F(x), we integrate the sine function from 0 to x. (a) To find F(π), we integrate sine from 0 to π: 
This means we're accumulating the weighted area between sin t and the t-axis from 0 to π: 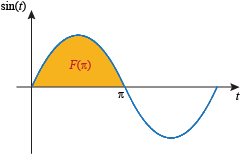
Evaluating the integral, we get 
The value of F(π) is the weighted area between sin t and the horizontal axis from 0 to π, which is 2. (b) To find  we substitute we substitute  in for x: in for x: 
On the graph, we're accumulating the weighted area between sin t and the t-axis from 0 to  . . 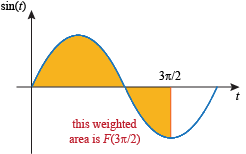
The value 1 makes sense as an answer, because the weighted areas 
and  cancel each other out: 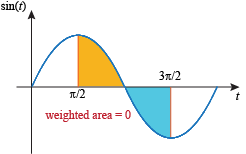
We're left with one-half the area 
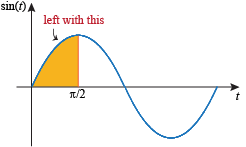
Since we found that  , ,
it makes sense for 
to be 1. (c) To find  we put in we put in  for x. The upper limit of integration for x. The upper limit of integration  is less than the lower limit of integration 0, but that's okay. is less than the lower limit of integration 0, but that's okay. 
You can write the answer as 
if you want. On the graph, we're accumulating the weighted area between sin t and the t-axis from 0 to  . This means we're integrating going left: . This means we're integrating going left: 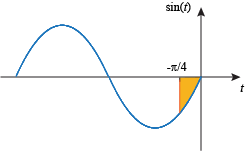
Since we're accumulating area below the axis, but going left instead of right, it makes sense to get a positive number for an answer. | 


 . Find each value and represent each value using a graph of the function 2t.


