Can you draw a picture and shade it in? If so, you qualify for the position "Systems of Inequalities Solver." The benefits are so-so. You will get less than or equal to your fair share. There will be no overlap in benefits, and you feel unequal to your peers! Sounds like a terrible job, but we would like to take you on a little job training.
The on-the-job training in this section will be learning how to graph and solve systems of inequalities. It's all about where regions of area overlap. We learned about where lines and planes intersect in the last section, but this section we want to know about where inequalities intersect. We'll show you graphical solutions and find out if specific points lie in solution the solution sets.
First, lets take a walk down memory lane and revisit what an inequality is. Here is an example:
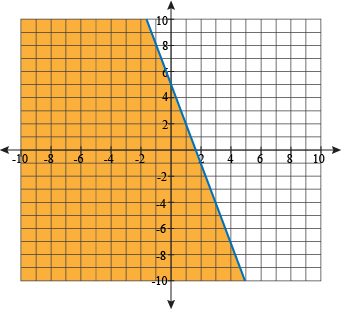
y ≤ -3x + 5
Suggestions for graphing this inequality are
- Try, try, try if you can to solve for y. It's much easier to shade that way. Hey! Guess what? It's already solved for y.
- Pretend it is an equal sign and graph like you would a normal linear equation (remember y = mx + b). Go up 5 on the y-axis and make your point for the y-intercept. Then you will go down 3, and to the right 1 to apply your slope.
- If you have the ≤ sign, you need to draw a solid line. If you have the <, draw a dotted line.
- If you have solved for y, and it is > or ≥, shade above. If it is < or ≤, shade below.
Here is the graph of y ≤ -3x + 5:
Sample Problem
Graph y + 3 > 2x2, state it's boundary and find a point that lies in the solution to the inequality.
To make things easier, we need to solve first for y (by subtracting 3 from each side). That gives us y > 2x2 – 3. Since we have a >, we need a dotted line for our parabola because the solution cannot be anywhere on that curve. Then, we can shade above since our solution is greater than. Here is the graph of the solution:
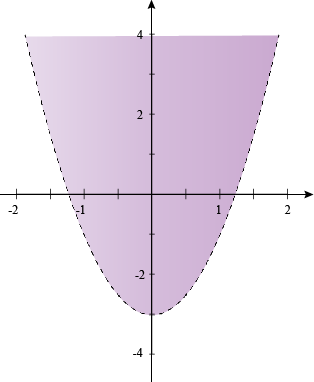
Notice the beautiful colors and shading. It resembles a cup of purple soup. No coloring outside of the lines! If you do, "No soup for you."
We must find a point within our solution of the inequality. How about (0, 0)? That clearly lies in the purple shading but let's check algebraically by substituting 0 in for x and y to make sure it satisfies the inequality.
y > 2x2 – 3
0 > 2(0)2 – 3
0 > -3
Yes! The point (0, 0) lies within the solution.
Sample Problem
Solve the system of inequalities and state the boundary.
y ≥ x2 + 1
y – x ≤ 2
Now we have two inequalities. The key here is that we need to think of each graph and find the intersection or overlap and that will be our solution.
We'll use the same method as before and try to first solve for y for each equation.
y ≥ x2 + 1
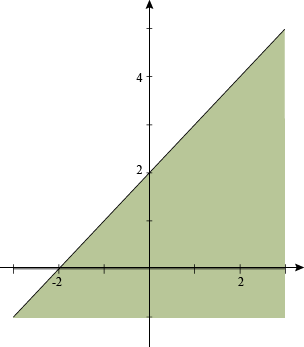
y ≤ x + 2
Graphing the first inequality, we get:

The second inequality looks like this.
Merging them together to find the overlap, we get:
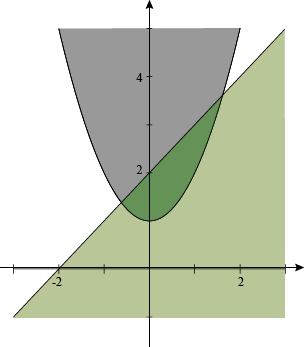
The solution is the intersection of the two shaded regions (the dark green region). The boundary of the solution are the equations:
y = x2 + 1
y = x + 2
Notice we used the equal sign here because we are talking about the boundary.
Sample Problem
Write a system of inequalities that has this solution (the triangle in the middle):
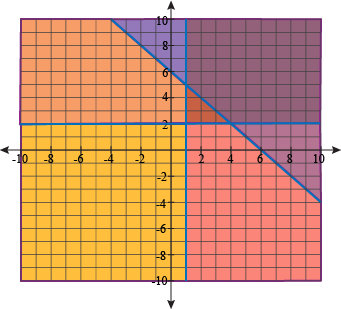
Let's deal with the purple region first. This clearly is the to the right and including the vertical line at x = 1. That means our first inequality is x ≥ 1.
Next we'll take the region above (and including) the horizontal line y = 2. Our second inequality is y ≥ 2.
Finally, we'll take the diagonal line of y = -x + 6. The shaded area is to the left (or below) the line. Since it is a solid line, the inequality is y ≤ -x + 6. Our system of inequalities is:
x ≥ 1
y ≥ 2
y ≤ -x + 6